New Amazon Search Analytics Dashboard to Help Grow Your Amazon Business
Amazon is not keeping us sellers in the dark anymore with the recent launch of the Search Analytics Dashboard will provide third-party sellers with insights on the search performance of their range of products.
One of the best things about the Search Analytics Dashboard is providing us, sellers, with a wealth of anonymized data to better understand customers’ interests and shopping choices for our products.
The data shows metrics of your products, covering all stages of a customer’s shopping journey (i.e. impressions, clicks, shopping cart adds, and purchases) helping you understand your sales funnel at the product level.
3 Steps to Access Search Analytics Dashboard
Check out the simple 3-step to access the Seach Analytics dashboard. Keep in mind that you need to be brand registered and have products sold on the Amazon marketplace to use this tool.
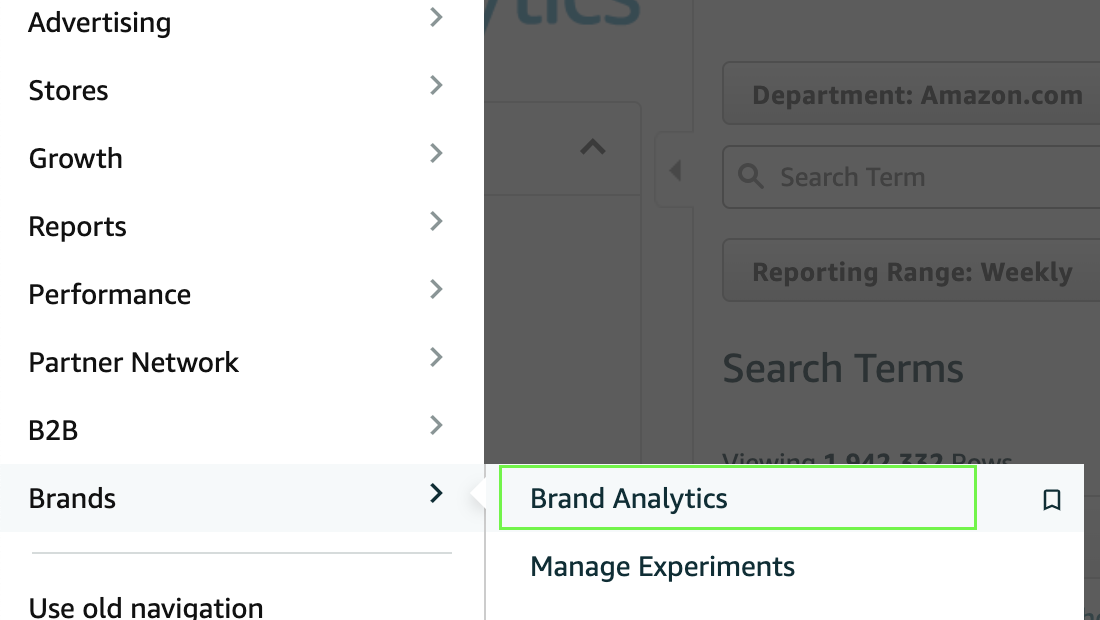
Step 1 - Navigate to Brand Analytics

First, navigate to Brand Analytics located under the Brands tab. Once you click on it, you should see a banner on top of the page with the “View Search Analytics” button as shown in the screenshot below.

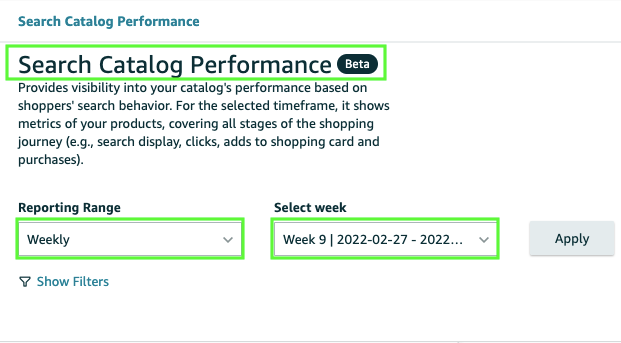
Step 2 - Select Reporting Range and Show Data

The next step is to choose your reporting range for your catalog’s performance.
For the reporting range, you have the option to filter the report by weekly, monthly, or quarterly. From personal experience, it’s more efficient to obtain your catalog performance on a monthly basis so you have more data to play with.

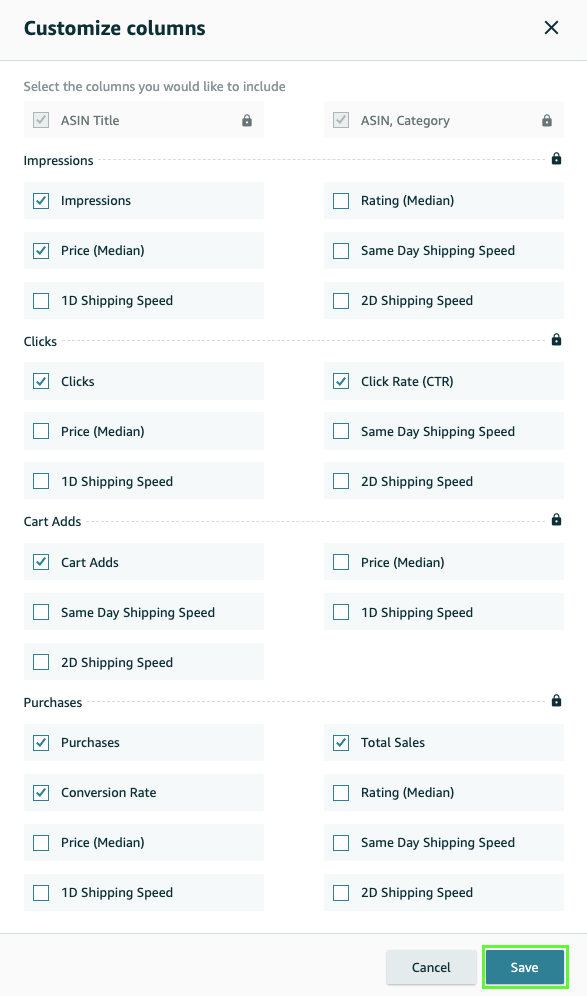
Apart from the dates, you have the option to customize data for each column to suit your optimization needs.

To learn more about the comprehensive definitions of all metrics offered in the search catalog performance dashboard, check out the metric glossary.
Step 3 - Analyze Data and Optimize
Once you have the data at your fingertips, it’s time to analyze it and optimize your product listings. Below are a few basic rules of thumb to abide by:
- If Impression is LOW, CTR is HIGH, and Purchase is LOW, then consider optimizing product listing (price, A+, and description).
- If Impression is LOW, CTR is HIGH, and Purchase is HIGH, then consider running ads to increase impressions.
- If Impression is LOW, CTR is LOW, and Purchase is LOW, then consider optimizing product listing (main image, title, price, A+, and description) to increase CTR and conversion rate.
- If Impression is LOW, CTR is LOW, and Purchase is HIGH, then consider optimizing product main image and title to increase customer click-thru and conversion rates.
- If Impression is HIGH, CTR is LOW, and Purchase is LOW, then consider optimizing product listing (main image, title, price, A+, and description) to increase CTR and conversion rate.
- If Impression is HIGH, CTR is LOW, and Purchase is HIGH, then consider optimizing product main image and title to increase customer click-thru-rate.
- If Impression is HIGH, CTR is HIGH, and Purchase is LOW, then consider optimizing product listing (main image, title, price, A+, and description) to increase conversion rate.
- If Impression is HIGH, CTR is HIGH, and Purchase is HIGH, then consider running more ads to boost impressions.
Feel free to add new rules to the above fundamentals and be sure to test and tweak them to maximize your results.
Final Thoughts
How do you increase your overall sales and profits? It can be challenging to do so not knowing how your product listing performs and which data point to look at for optimization.
Thankfully, Amazon launched the Search Analytics tool that allows you to analyze your brand in greater depth.
Drop us a comment below should you have any questions.


